
")


 |
 |
| View into a Eunotia culture (click to enlarge) | |
Size of the diatoms in a chain-like colony III
Synchronicity
The essential prerequisite for the correctness of the description by a D0L-system is the synchronous division of the diatoms, which is not of permanent nature. It was stated that longer chain-like colonies are found primarily in cultures. An investigation of a longer chain that has grown in a culture is likely to be very time-consuming and not very promising. If only the consistency of short fragments with the theoretical sequence is examined, the requirements for synchronicity may be lower. The first occurrence of a fingerprint in a generation m means that m generations are required to produce the observed pattern for the first time from a single cell. Also the coincidences in later generations need precisely m generations to develop from a single cell. To match with the theoretical sequence it is therefore sufficient if synchronicity is retained over m generations. In the example the fingerprint appears in the 5th generation for the first time, so that the relative deviations in the generation times must be less than 20% in order to preserve the pattern of the fragment.
If, for a fragment consisting of L diatoms, the number m is such that 2m-1 < L ≤ 2m, then the pattern appears at the earliest in the generation m. Unfortunately you cannot rely on it. Let us look at the tree of generations once again. From the first cell two daughter cells are generated simultaneously in the first generation. In the nth generation, 2n-1 diatoms have emerged from each of these two cells. They correspond to two strings of length 2n-1, which are adjacent to one another in the middle of the n-th generation. A fragment containing diatoms from both halves in the n-th generation has different ancestors in the first generation, i.e. n-1 generations earlier. A synchronous development must then be given over n-1 generations in order to guarantee a consistency of the sequence of sizes with the theory. If one considers the development of sequences that arise from neighboring diatoms in other generations (> 2), one finds in the same way that fragments in the generation n can also have different ancestors n-2, n-3, .., 1 generations before.
So far, the chains of diatoms have always been treated as if all the diatoms are located between two divisions. If the divisions are no longer synchronous, one must expect to find fragments in which the diatoms are in different stages of division. In this case it can be seen at first sight that the modeling as a Lindenmayer system is beyond its limits.
Example of synchronicity over a few generations
 |
If a diatom culture is started with a single cell and the diatoms are counted at periodic intervals, one can often observe that deviations from the power law 2n occur after three or four generations. The same will be expected for chain-like colonies. The picture on the left shows a sample from a small brook (click to enlarge). One can see a very young Melosira colony, which has developed after auxospore formation. This finding makes it possible to determine the maximum size of the diatoms, but the differences in size between the cells of adjacent diatoms are also in this case very small. The colony is, however, well suited for observing the synchronicity of cell divisions. It was transferred into a culture vessel containing nutrient solution, where it developed well. After three days it looked like this (click to enlarge):

The diatoms exhibit different stages of division with a small-scale order. The development seems to be synchronized over only two to three generations. This is even more striking in a time-lapse recording. For this purpose, the culture was observed for several days near a lamp at about 200 lux without additional illumination. A simple macroscope was used, as shown on the page about equipment for observation. The objective was a Zeiss Luminar with a 25 mm focal length.
On the left the resulting time-lapse video can be viewed (3600 times faster than real time; full screen mode is recommended). The brightness fluctuates due to changing additional daylight incidence. The dark sections in the video correspond to the dark phase of the lighting (daytime cycle with about 12 hours light per day). They were extremely shortened in the video. In darkness the division processes come to a standstill. It is noticeable that asexual reproduction occurs in changing more or less large sections. Here the chain expands. Between the cell divisions there are larger periods of time in which no progress can be observed from the outside at this low resolution.
A similar observation was made on a cultivated Eunotia sp. On the left you can see a video in 7200-fold time-lapse. Here the culture was kept permanently under the microscope's LED illumination for a period of 70 hours. Since Eunotia is motile, diatoms can move away from the ends of the chain and even from positions in between. As the chain expands, the colony detaches and bulges from the substrate. As in the example of Melosira, one recognizes locally different stages of division and accordingly different temporal lateral expansion of the colony. In cultures, however, very long chains with a uniform structure often occur. It is unclear whether the day-night rhythm has a synchronizing effect here.
Beyond the D0L-system
Deviations of the generation time are likely to be of a statistical nature. The longer a colony develops, the more deviations from the deterministic model are to be expected. If the synchronicity is given over a maximum of k generations, there will always be sections with up to 2k diatoms that match the D0L-system. The applicability of the model is limited to k generations.
Numerically one can model systems in which the time between successive divisions has a random component, but the predictive power of such a model with a stochastic component is limited. Presumably the general behavior, as it can be seen in the video of the Melosira culture, can be reproduced. An approach is briefly outlined. As soon as a diatom is generated by division, an individual time segment begins until two diatoms arise in the same initial state. As with Pascal’s triangle or the sequence of the generation in the presented visualization, the time axis is oriented vertically from top to bottom. Each division is to be visualized by a triangle. The tip of the triangle represents a diatom before its division and the opposing vertices stand for the daughter cells after completed fission. The height of the triangle is chosen proportional to the duration of the division process. Depending on the orientation of the diatoms before division, there are these possibilities which correspond to the production rules: 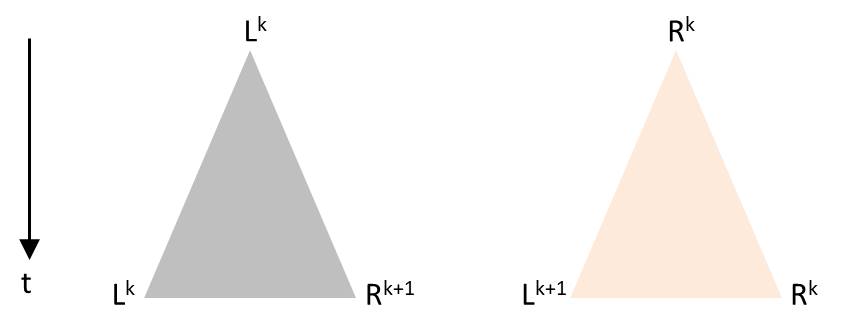
The angles in the triangle are chosen in a way that the triangles in the drawing are not overlapping. Starting again with L0, such a sequence for example could arise:
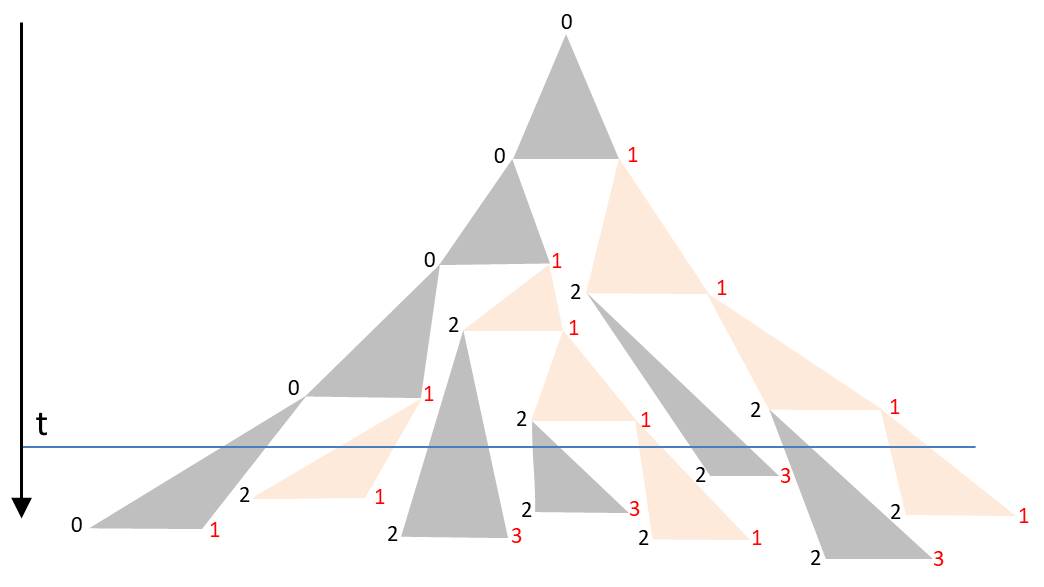
The orientation of the diatoms was again visualized by the font colors. The corners of the triangle form a binary tree. The duration of the subsequent cell division is assigned to each node. If one chooses them identically, the described D0L model is reproduced. The more these time intervals fluctuate around the mean generation time, the lower the synchronicity. For a realistic model one would have to determine the probability density of periods of cell divisions by observations. It is also possible to take into account dependencies and correlations. Laney et al. (2012) have shown in their paper ‘Diatoms favor their younger daughters’ that the daughter cells of the marine centric diatom Ditylum brightwellii have different periods of division. The diatom which inherits the smaller hypotheca exhibits a more rapid division than her sister, that got the larger epitheka. If this also applies to the chain-like colonies considered here, the synchronicity would already be lost due to this effect.
At a certain time t the colony is found in a state characterized by the intersection line along the horizontal. The blue line in the diagram gives an example. Due to the strongly fluctuating division periods there is no alternating orientation of the diatoms. As mentioned, the spatial separation of the diatoms becomes apparent only in the lower part of the triangle.
Flexibility of chains and breaking points
Finally, I would like to discuss a text passage from the publication by Ussing et al. (2005). It states:
“The flexibility of chains, which affects their entanglement (Karp-Boss et al. 1998) might depend on the nonuniformity in size predicted by this model. Smaller cells may also represent weak points in the chain at which it could fragment in a turbulent environment or during predation. So this simple mathematical model may have some life cycle and ecological consequences.”
In many chain-forming species the relative size differences between successive valves are small. Even in the well analyzable example of the Fragilaria colony, these were only about 0.6%. The differences in the size of the valves for instance in the cultivated Melosira are so small that they are hardly perceptible even in big colonies. In a fragment which appears for the first time in generation m, the largest and the smallest size index differ by m at most in the case of synchronous division. This is not much in the case of small fragments which are usually found. In our example we have m = 5 but the difference between the size index of the largest and smallest diatom is only 3. As has been shown connected diatoms always have a difference in size of one step, at least in the case of synchronous divisions. You can hardly speak of a "predetermined breaking point ". If the cell divisions of diatoms are not synchronized, deviations from these rules may occur. As the duration of division process does not differ by orders of magnitude, this cannot drastically change the situation. I would not like to deny the influence of unequal sizes of diatoms but also not to overestimate it.
Karp-Boss, L. & Jumars, P. A. (1998). Motion of diatom chains in steady shear flow. Limnol. Oceanogr., 43, 1767-1773
S R Laney, R J Olson and H M Sosik, Diatoms favor their younger daughters, Limnology and Oceanography, Vol.57, No.5, pp.1572–1578, 2012.
USSING, A.P., GORDON, R., ECTOR, L., BUCZKO´ , K., DESNITSKIY, A.G. & VANLANDINGHAM, S.L. (2005). The colonial diatom ‘‘Bacillaria paradoxa’’: chaotic gliding motility, Lindemeyer Model of colonial morphogenesis, and bibliography, with translation of O.F. Müller (1783), “About a peculiar being in the beach-water”. Diatom Monographs, Vol. 5. Koeltz, Koenigstein, Germany.